In a manner of speaking this is true. Both involve races of short duration with high aerobic and anaerobic components. The following analysis will look at two crits and two cross races, each with different qualities. I'll include four graphs with power and pedaling metrics for each, which I hope will illustrate the differences in race demands and therefore differences in the training required (aside from the obvious bike handling differences), especially for a perfectly average roadie like myself. Jeremy Powers has a 400w(?) ftp and can hit 1400w out of every corner in a cross race, but few of us mortals can do the same. All graphs come from WKO4, build 173.
The first cross race (Quad) was a decent combination of grass crit and riding in the woods, complete with an uphill barrier, U-turn in sand, and a couple long power sections to balance out the turny/carving sections. A pretty well rounded course. The second cross race (White Park) had only one long and one medium power sections, and otherwise required very short bursts between sharp turns, both on flat ground and off camber.
The first crit (Wells Ave) is a long oval with one corner barely sharp enough to require not pedaling. It's not technical at all (and is in fact the closest thing to a race in a straight line as you can get), but this day was full of primes, making and chasing breaks, and a (rare) race winning sprint. The second crit (Keith Berger) is a classic six corner office park deal with 90ish degree corners, some crosswinds, and a 200m last-corner-to-finish-line sprint.
Here are the first four time-in-zones charts.
Quad CX
White Park CX
Wells Crit
Keith Berger Crit
But now let's look at the last metric on these graphs: average and normalized power for the races. Both metrics for crits are significantly higher than they are for cross. You may be asking why, with lower average and normalized power, I'm spending the same time in the same zones between crits and cross. WKO4 models your effective FTP, and with a lack of long steady efforts, right now mine is modeled at a meager 250w (in June/July it was in the low 320s, but now with little maintenance since August, it's probably back around 300). What this really says is that I'm sprinting out of each corner and then recovering on straightaways at mid to high tempo wattages. So like I discussed in my last post, I may need more aerobic intervals in cross season in order to bring up these power numbers. It may be different for you.
Next, to confirm, let's look at the mean maximal power (MMP) graphs.
Quad CX
White Park CX
Wells Crit
Keith Berger Crit
The right side of the cross graphs show some different bumps, thanks to the terrain of the courses. That kind of thing is rare to see in MMP graphs of road races, but it's here at Keith Berger thanks to a well executed but ill timed last lap attack.
Now we'll see some graphs that illustrate the different muscular demands.
Quad CX
White Park CX
Wells Crit
Keith Berger Crit
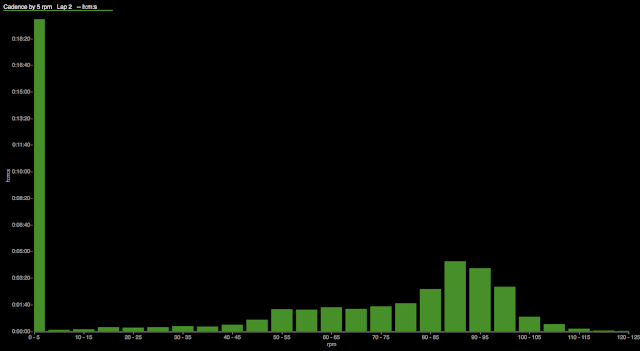
Now things are coming into sharper relief. The first and most obvious aberration to the pattern is how little of Wells was spent coasting, but like I said it's basically a straight line so very little coasting through corners. The cadence distribution in both crits has a median over 95rpm (highly aerobic), while for the cross races the median is around 85, and heavily skewed left.
Also notice the time spent not pedaling. In Keith Berger, the more technical crit, there's only a few less minutes not pedaling than in either cross race. Time in those super low cadence bins does add up. Longer contractions are highly anaerobic, and create large demands on fast twitch fibers, which in turn creates a premium on mobilizing glycogen for these things. Don't mistake this for saying cross isn't an aerobic sport, though. Your heart rate is pinned for 40-60 minutes because you're trying to supply as much oxygen as you can to your muscles. This still puts cross firmly in the endurance category, but it does blur the line between aerobic and muscular endurance.
Again let's confirm what we just discussed with some quadrant analysis.
Quad CX
White Park CX
Wells Crit
Keith Berger Crit
I think that's about as stark as it can get. The first two graphs (cx) show significant distribution at low CPV, high pedal force, while the second two graphs (crits) show most of the pedaling done in the high CPV, low pedal force quadrant.
This hints at what I discussed in my last post. In cross your aerobic engine is pinned through the whole race, and fibers heavily relying on anaerobic metabolism need to refuel with blood sugar, but such high muscular demands create more need for glycogen mobilization than a crit does (though some certainly can do the same). Of course there are no hard and fast rules to any of this, though I hope I've illustrated some of the physiological differences between cyclocross and criteriums.


No comments:
Post a Comment